A simple way for E-detecting of Fluoresceine.
Fluoresceine, used for tracing waterflows, is normally detected with active Carbon receptors.
These receptors need to be replaced at certain times in order to know how many hours / days it takes for the water to appear.
It's a lot of work to do it this way.
So I thought about a (cheap)way to make things easier.
How does it work;
The principle idea is to place a sensor-device into the waterstream.
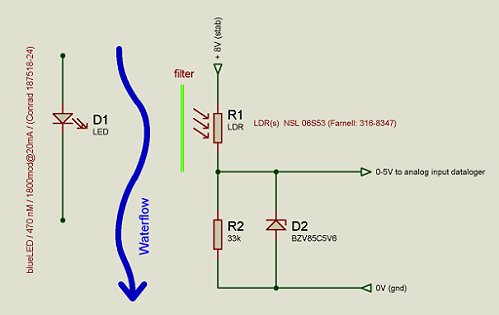
In this "device" there are two Light Dependend Resistors and one
lightsource.
Each LDR has a colorfilter made out off thin plastic-film (like they use
in discolights).
One LDR has a Yellow/Green filter and the other a blue filter.
The light source is a blue LED (470nm)
 |
 |
The resistance of the blue-filtered-LDR depends mostly on the visibility
of the water and will change only a little when there is Fluoresceine in
the water.
The resistance of the yellow/green-filtered-LDR will change dramaticaly
when there is some Fluoresceine in the water.
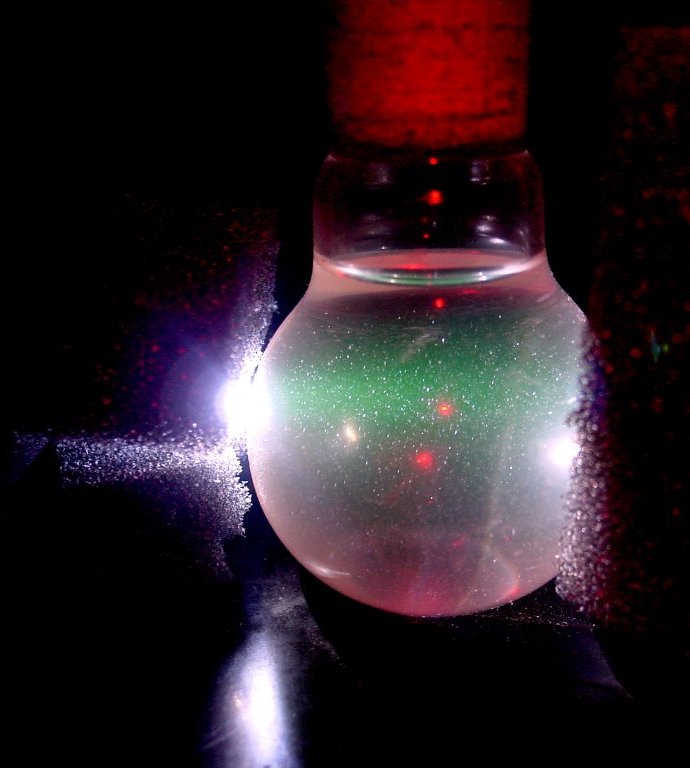
When these two measured values are displayed in to a excel-graph, it's easy
to see if there was fluoresceine or not.
It's important to place the LDR's in a 90 deg. angle to the Blue LED and
to be sure there will be as little as possible light from other sources.
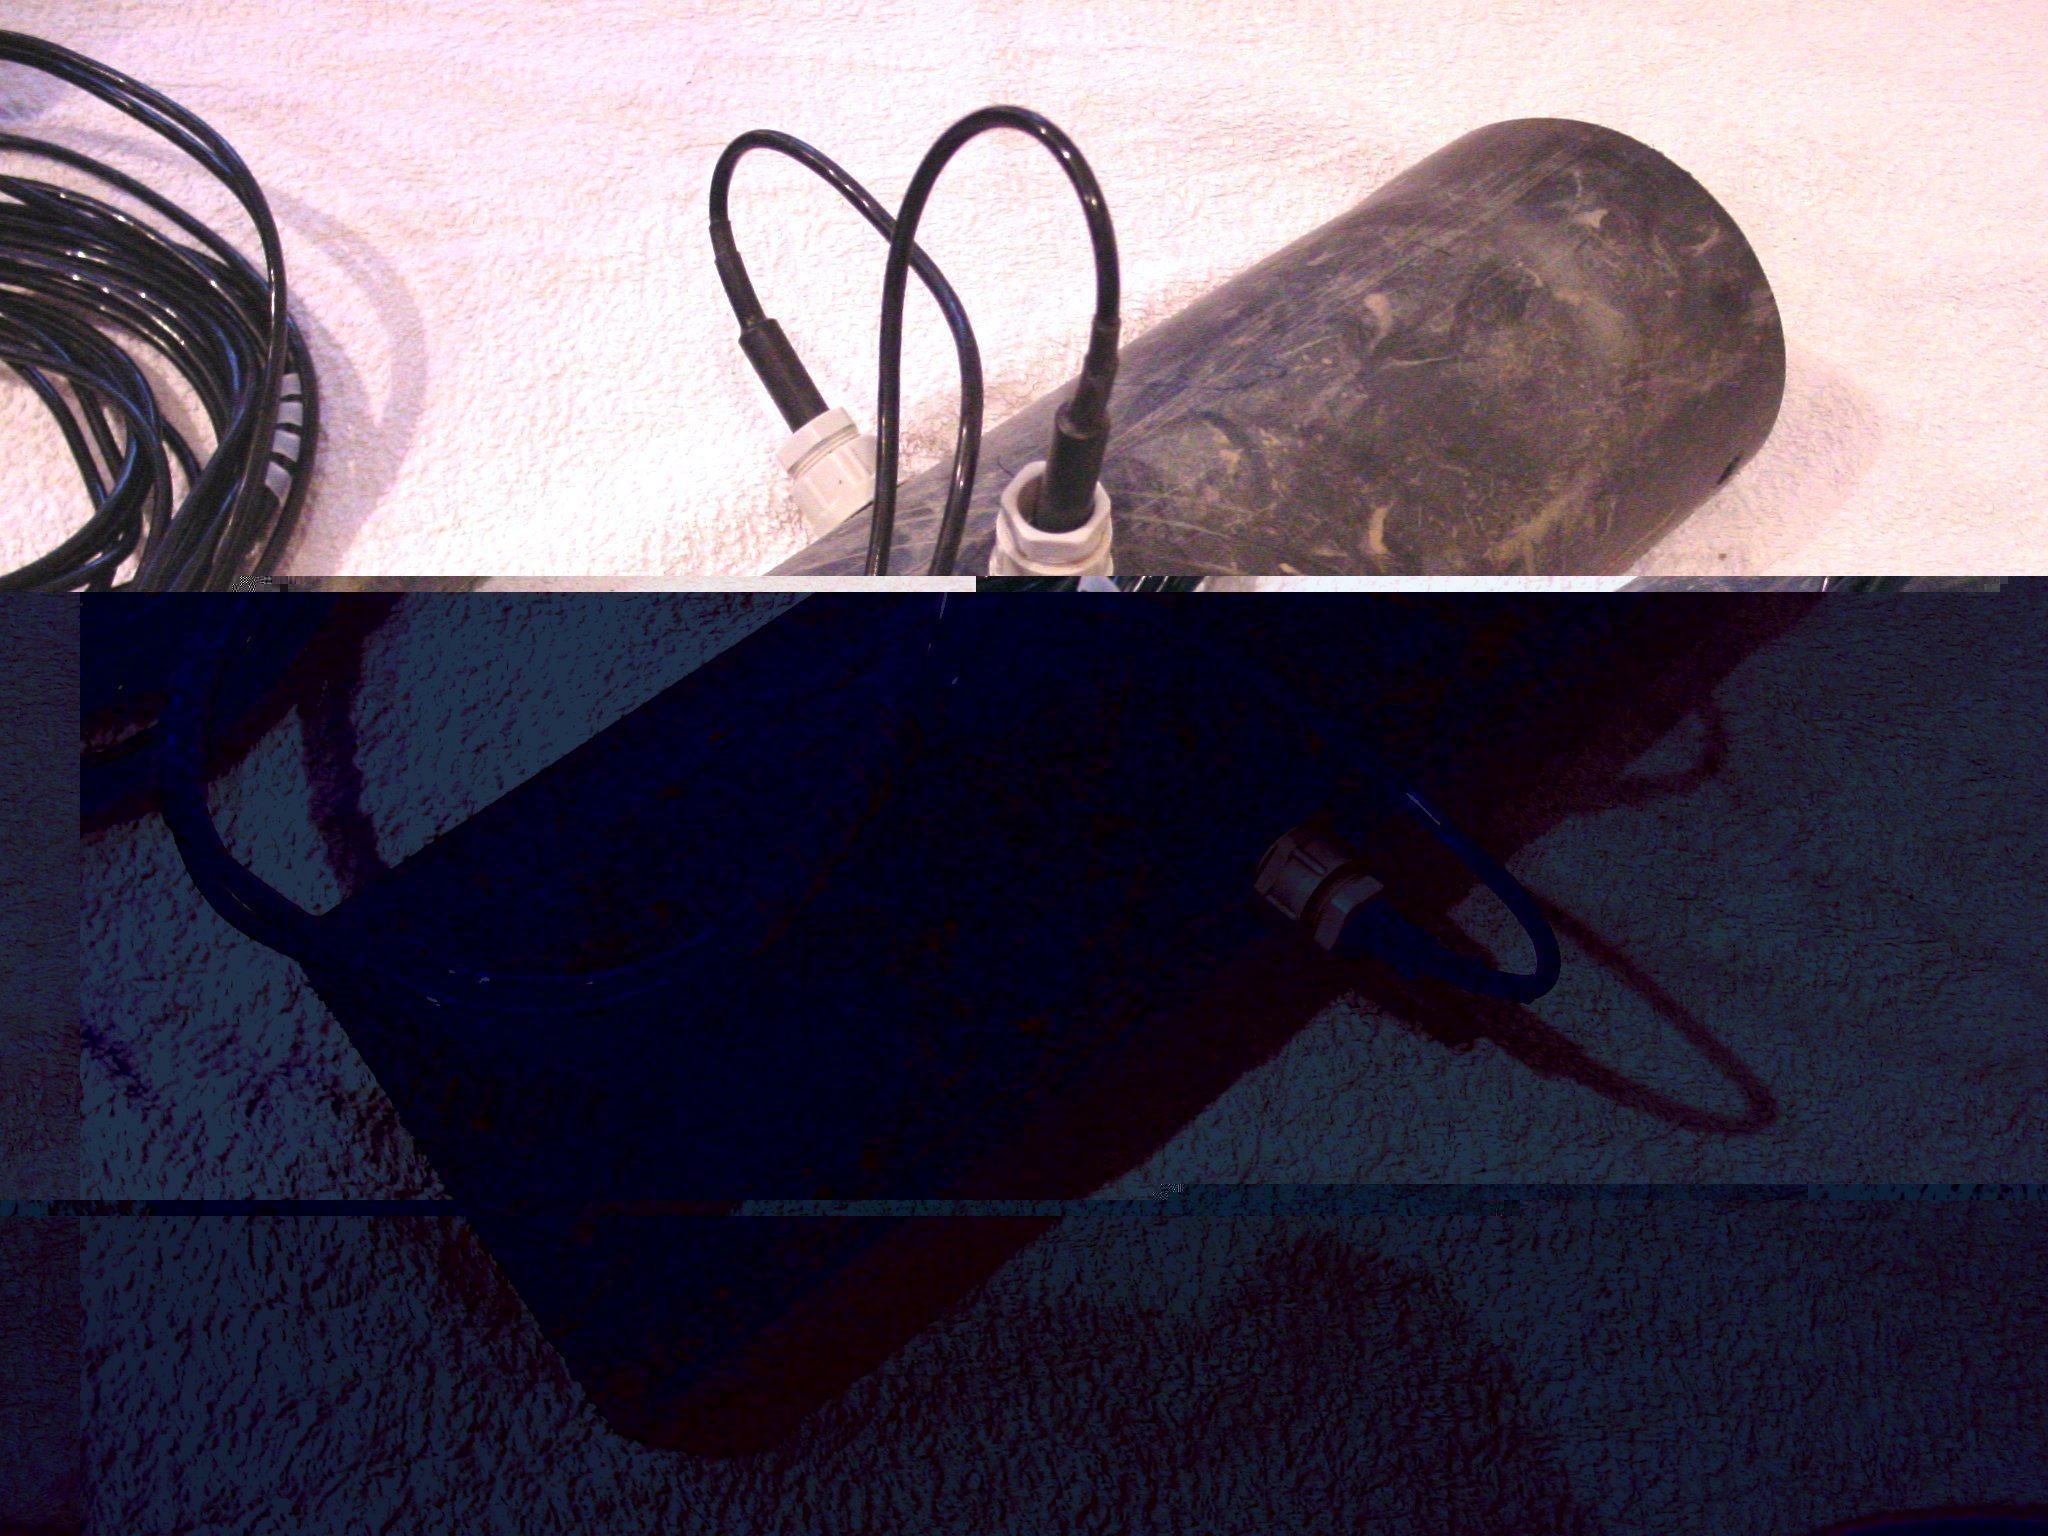
For this I used a Black plastic tube (r=60 mm) filled up with a dozen of
small black tubes (r=8 mm).
 |
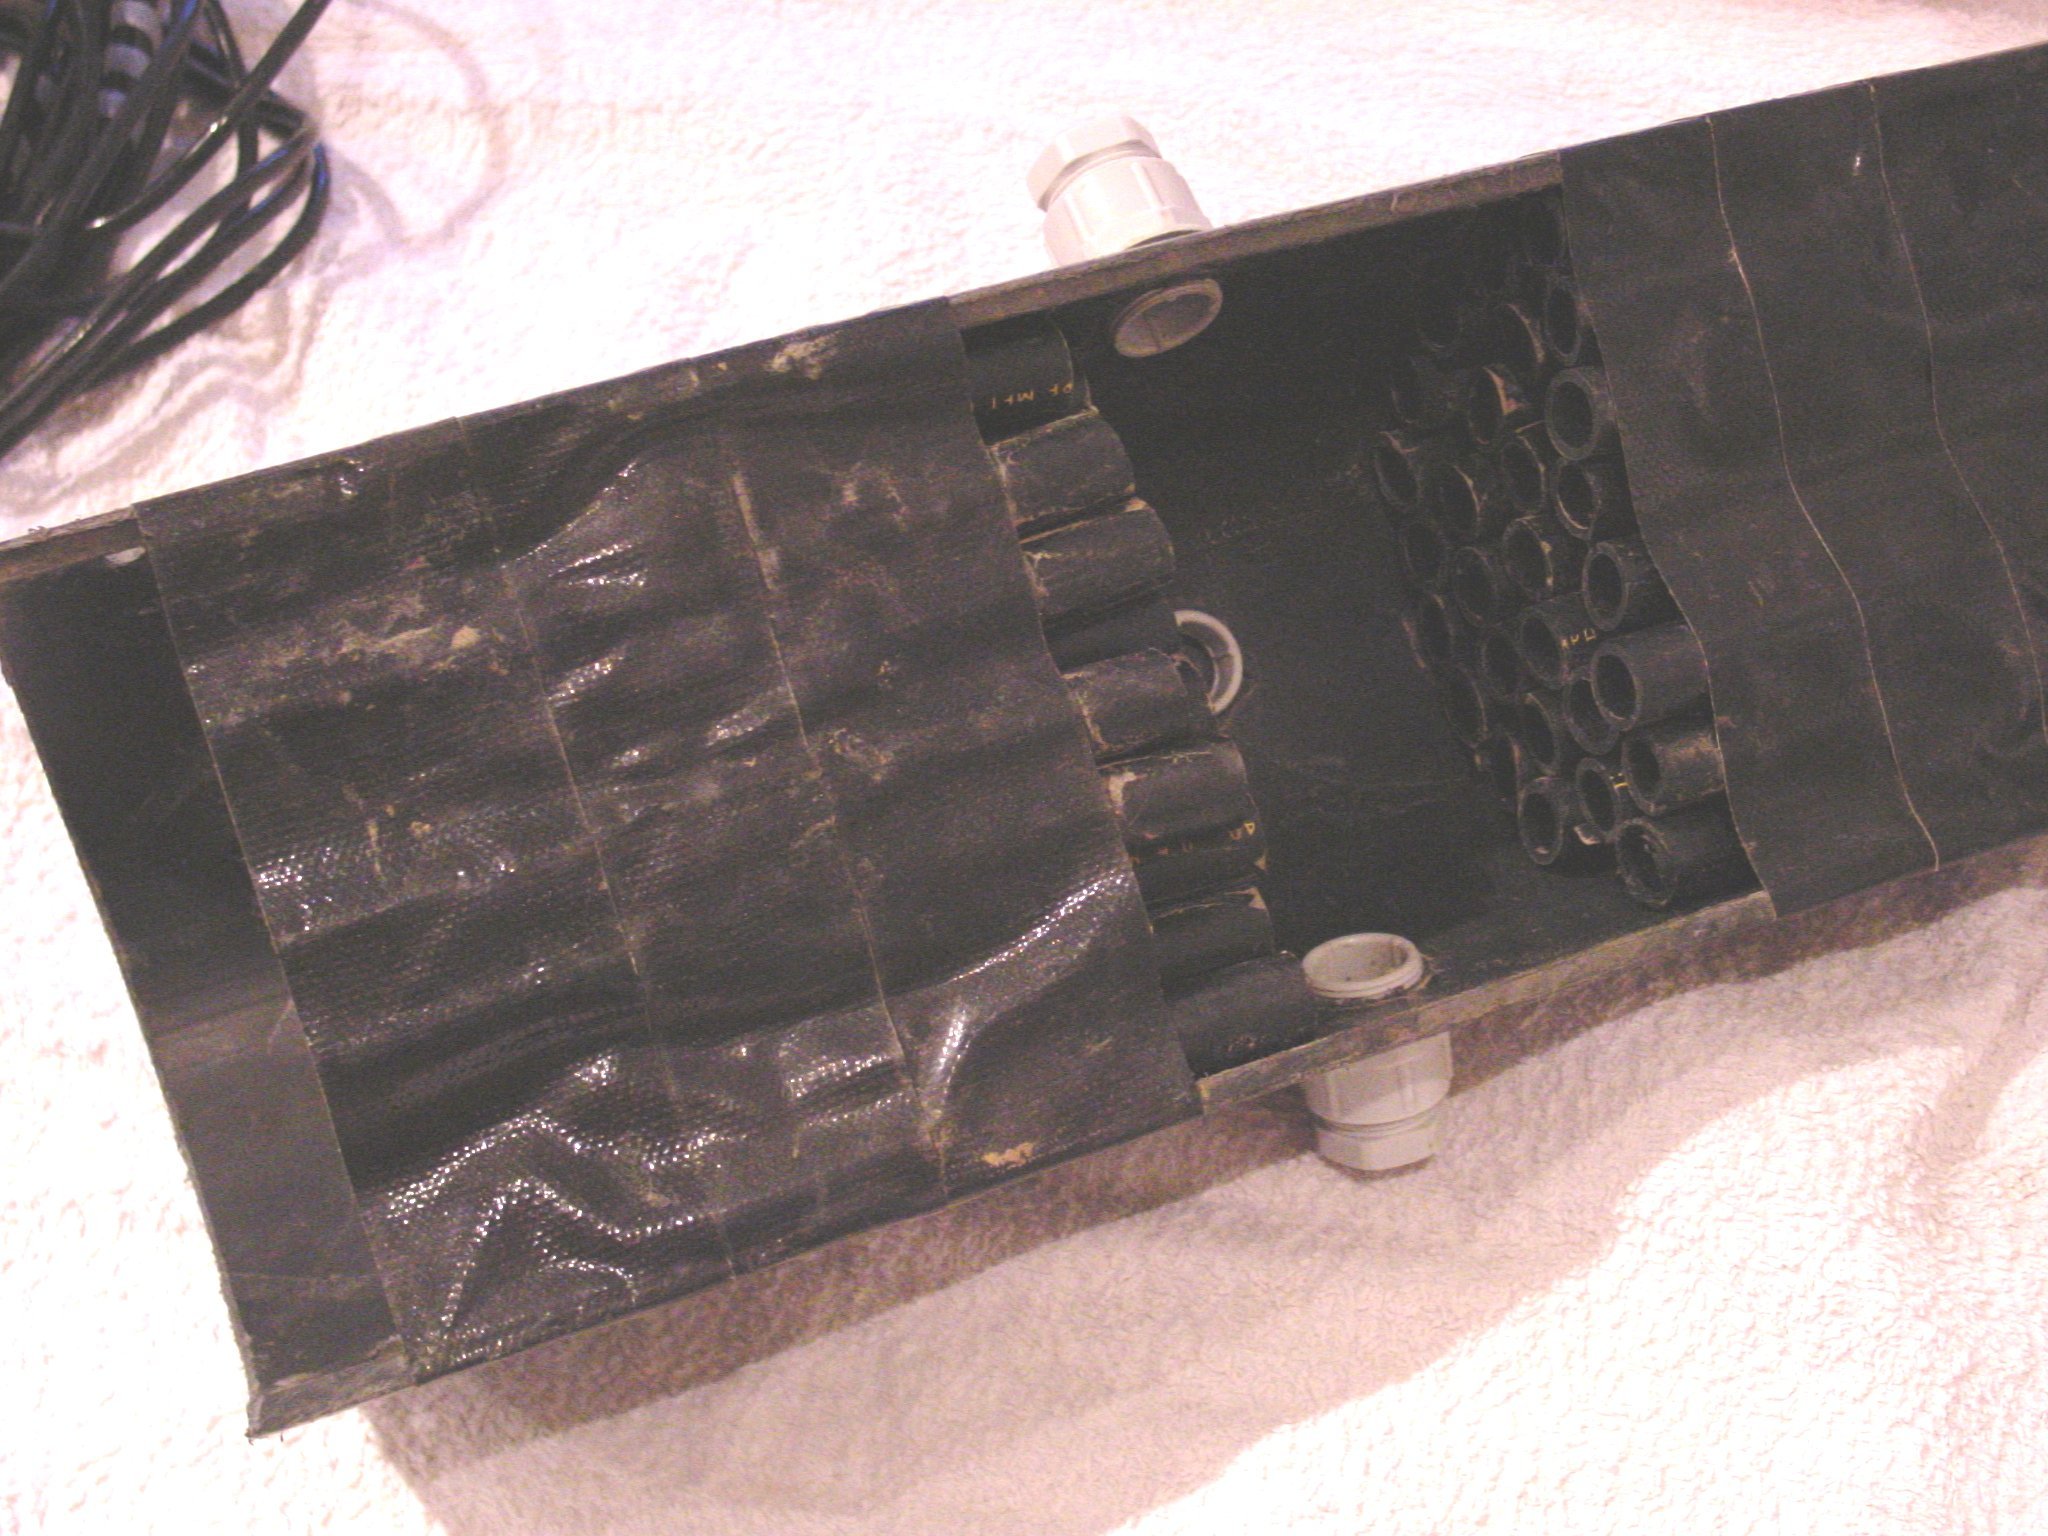 |
The LED and LDR's are placed into the middle.
To make a watertight construction for the LDR's and LED, I have put them
in to (glass)test-tubes and filled them up with clear-epoxy.
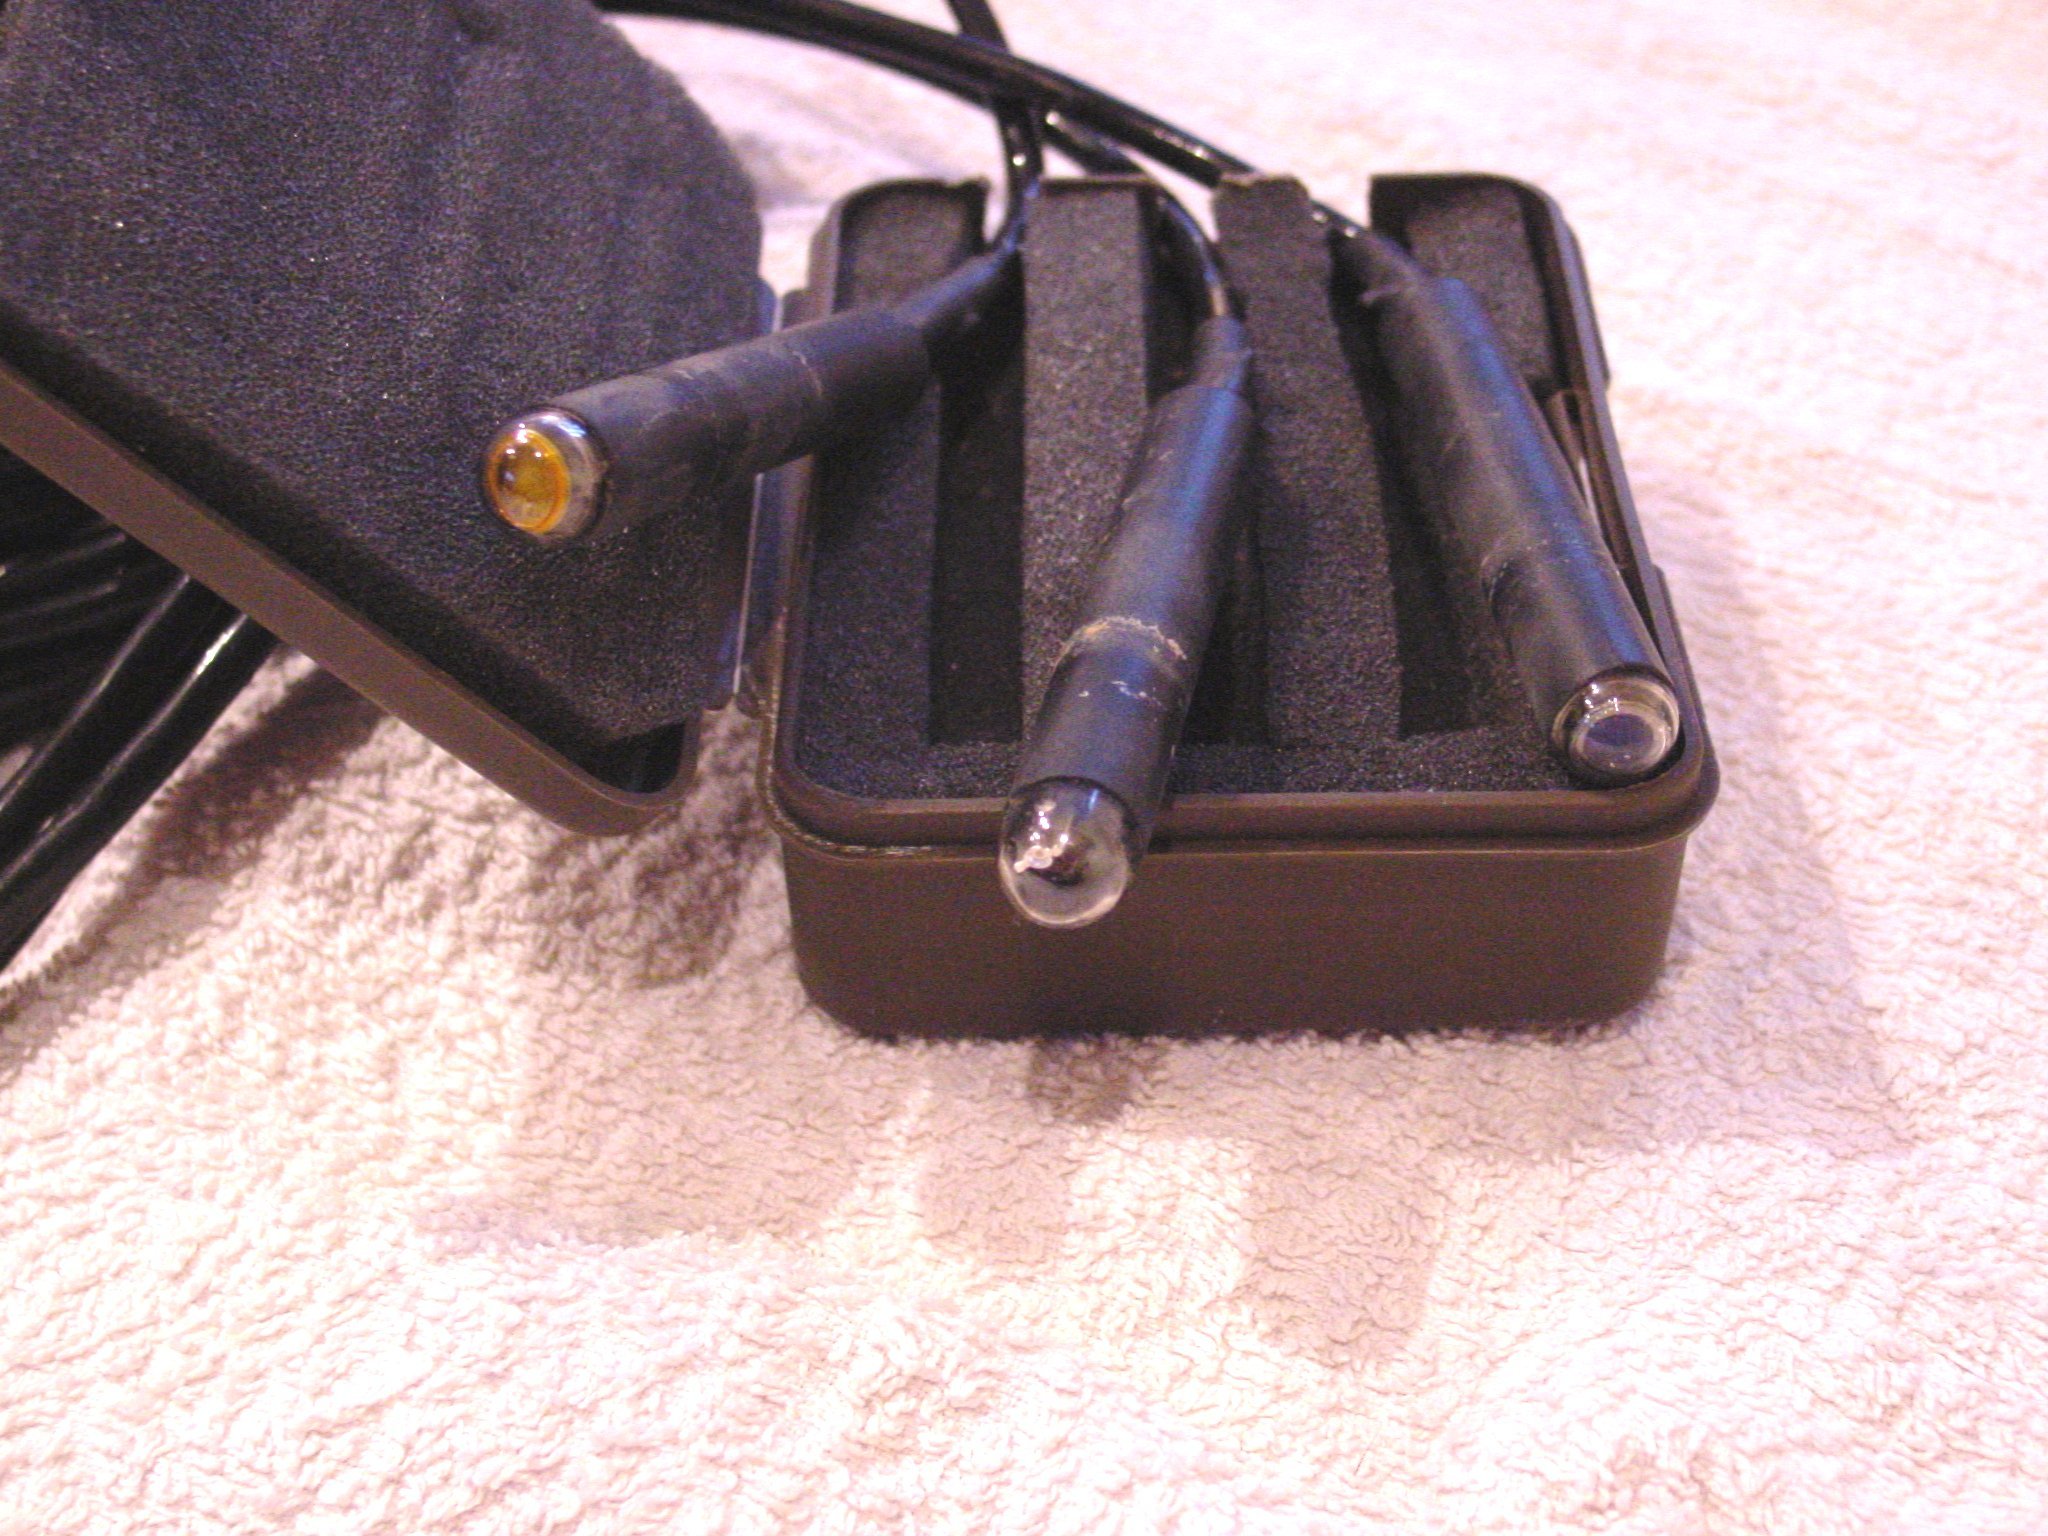
Now there is very little external light and water runs through freely.
Tests have allready proven it's a very accurate and sensitive method (something like 0.02 ppm).
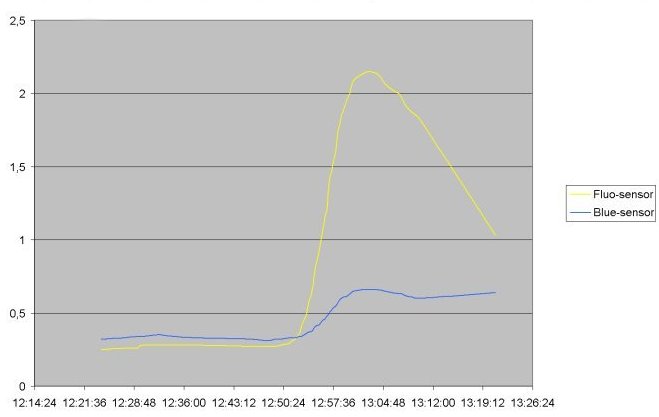
Where the blue-sensor rises (after the peak Fluo-value), we have created a sudden "muddy stream" in the river.
A datalogger is needed for storage.
Any two-input datalogger (0 - 5V) will do fine.
In that case just add the sensors and Led (and R11, R12 & D3, D4) whit
8V supply to your datalogger.
While powerconsumption is an item for longterm operation, it's best not
to leave the LED on when it's not needed.
On the other hand, LDR's need some time to react on changes in light differences
(at least 10 sec).
In the described datalogger the LED-power is a bit reduced between measurements.
The LED will stay on at low power (2 or 3 mA) and will go to "high"-power
(10mA) before measurement.
But the total power consumption (12V) for a whole minute is still less then
10 mA.
For this I designed a simple datalogger which "takes" a sample
every minute and switch-on the LED 10 sec before measurement.
A PIC16F877 does most of the job. It stores it's data into two EEPROMS,
each 32Kb.
An LCD is used for the reading (proces, results and menu-controlled opperation
etc.).
Three buttons are used for control.
It's also possible to dump all data to a com-port of a PC or Laptop.
All you need is a program like Hyperterminal (or something like it) / (8
databits, no parity, 1 stopbit, harware=off & 9600 baud).
Copy all data to "notepad" and import the text-file into excel;
and you're able to make nice graphs.
I will explain the menu-structure, but you can go to "downloads"
for the full program.
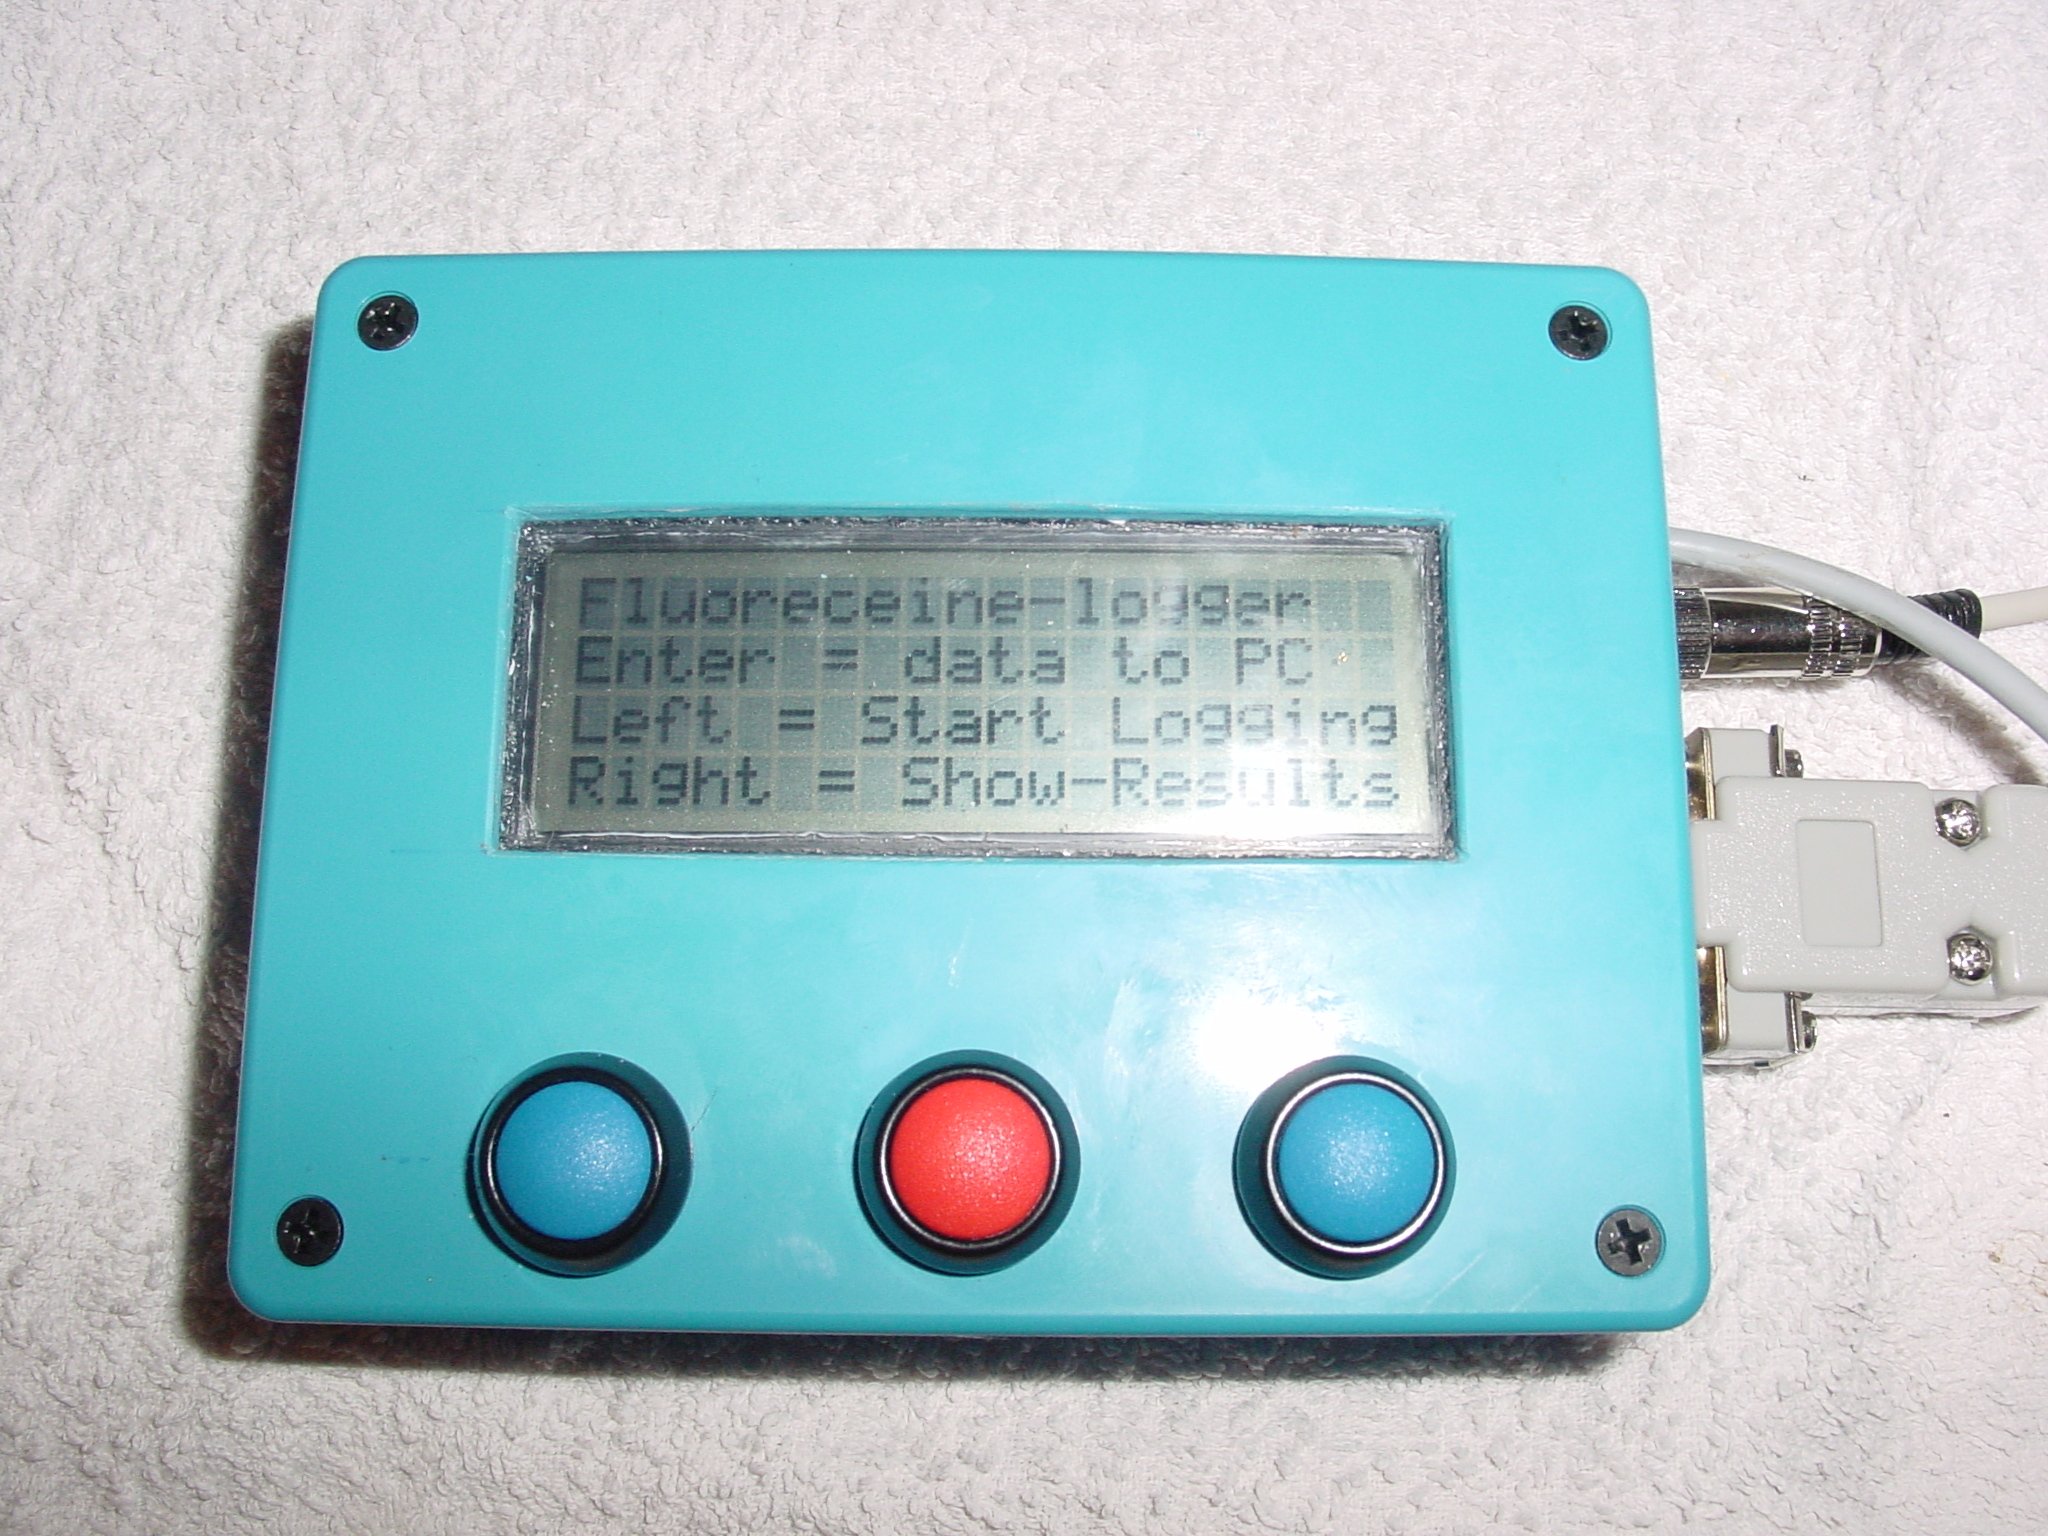
When powering-up.
After a "welcome", there are 3 choices:
1: Dump all data to PC, by pressing the enter key.
just make a connection to your PC/laptop com-port and run Hyperterminal
etc.
It will directly dump all data after the button is pressed.
2: Display (on LCD) recorded data, by pressing right-button.
It will display: the readout for the Fluo-sensor as well as the Blue-sensor
(0-255) and the (passed)time for each record in day(s), hour(s) & Minute(s).
You will then have 2 choices:
1: Goto ALL records, by pressing the left button.
Now you can scroll up- and downwards by pressing the right and left button
(from start recording)
You can do this by pressing once for one step or holding the key for continuously
scrolling.
When holding down the key, after 10 "steps" each step will represent
15 minutes for fast scrolling.
You can exit from here by pressing the enter key for main menu.
2: Go directly to the maximum recorded "Fluo"-data-record, by
pressing the enter button.
Now, you jump directly to the record with the maximum recorded Fluo-value
( don't need to scroll too much)
The readout will give both value's (Fluo & Blue) and the total time
after start of recording.
From here you can scroll up and downwards with the right and left buttons.
You can exit from here by pressing the enter key for main menu.
This option is only available as long as the power is left on after recording.
3; Goto menu for recording data.
Again; 2 choices.
1: Press left button for new recording.
you will be asked if you're sure or not.
(right for NO (back to main menu) or enter for YES)
After pressing the enter button, all data will be overwritten.
Each minute a readout will be recorded etc. from record zero.
The display will give the actual recorded time and values (at that moment)
and the time where the max. fluo is recorded.
To stop the process, just press the enter button.
Now, for the next 500 records, a zero value is written (in case of old recorded
data.)
After this you will be back in the main menu.
2: Press right button to continue prev. recording.
After you have read out the data (manual or to PC) you can continue the
logging.
All prev. data will be kept in memory incl. the max. Fluo-value/time etc.
There is a standard pause added for 5 minutes (written a zero value) after
the last recorded data (not the extra 500 of zero).
To stop the process, just press the enter button.
Now (again); for the next 500 records a zero value is written (in case of
old recorded data.)
After this you will be back in the main menu.
On the PCB is a jumper installed.
When the jumper is closed the datalogger works without the LCD and Enter
button.
When the logger is connected to the battery, it waits until a button is
pressed.
Left-button will start a new logging.
Right-button will dump all data to PC (RS 232).
Once a button is pressed their function is inhibited until power is switched
on again.
(protection)
The reason for not to install the LCD can be the cost of EU 28,-- (almost
as much as the cost of the whole datalogger).
In that case you can always install the LCD later and remove the jumper
for full control.
For those who have problems to program a PIC, I can do this for you; only
charging the price of the PIC and postal-charges.
Just send me an E-mail; erwin.lokhorst@net.hcc.nl or erwin@vollok.nl
Downloads for the Fluoresceine detector
Electrical design.
fluoresceine detector circuit.pdf
(use Adobe Acrobat)
fluoresceine detector circuit.DSN
(made with Proteus lite)
PCB-layout.
fluo-detector PCB layout.pdf
(1:1 bottomcopper / PCB-film ready)
fluo-detector component
layout.pdf (with all parts at the PCB-top)
fluoresceine detector.LYT (made
with Proteus lite)
Software.
logger (1.2).bas (PicBasicPlus program,
also readable with a simple text-editor, like notepad)
logger (1.2).asm (assembled sourcefile)
logger (1.2).hex (to be programmed in the
PIC16F877)